This article covers the NVIDIA vs. AMD discrete GPU market share from 2010 to 2025. The market share data provided is annual, representing the average of all four quarters.
For example, if you’re interested in the NVIDIA vs. AMD market share for 2021 or 2024, the figures presented in our table are the average calculated from Q1, Q2, Q3, and Q4 of that year.
If we analyze NVIDIA and AMD GPU market share, we can observe that over the past decades, NVIDIA and AMD have engaged in a relentless battle for dominance, with NVIDIA often emerging as the market leader due to its substantial investments in research and innovation.
These advancements have influenced a wide range of devices, from high-performance gaming desktops and laptops to efficient business laptops and workstations, where GPU performance plays a key role in delivering both speed and visual quality.
Looking at the historical comparison chart of AMD and NVIDIA from 2009, both companies performed well for the first five years, but it is clear that NVIDIA has made game-changing moves from 2014 onward.
NVIDIA’s strategic innovations and robust product offerings have propelled its market share to impressive heights, while AMD has worked tirelessly to close the gap.
The year 2014 was a turning point for NVIDIA, largely due to the launch of the GeForce GTX 900 series, which showcased groundbreaking advancements in performance and power efficiency.
With substantial investments in research and development, NVIDIA has not only revolutionized gaming graphics but has also positioned itself as a leader in artificial intelligence and machine learning applications.
The impact of these innovations is especially evident in gaming laptops and desktops, where high-performance GPUs are crucial for seamless gameplay and visual fidelity.
Meanwhile, AMD has made notable strides of its own, presenting compelling alternatives that challenge NVIDIA’s supremacy.
Both companies are excelling, and we are witnessing massive enhancements from each.
Today, we will explore the GPU market shares of NVIDIA and AMD from 2010 to 2024, examining key statistics and trends.
We will also predict the market shares of AMD and NVIDIA based on historical data and current developments.
Annual Market Share of NVIDIA vs. AMD Discrete GPU (2010-2024)
The AMD and NVIDIA discrete GPU market shares from 2014 to 2024 are as follows:
| Year | NVIDIA | AMD |
|---|---|---|
| 2010 | 55.5 | 44.5 |
| 2011 | 59.21 | 40.79 |
| 2012 | 62.72 | 37.28 |
| 2013 | 63.77 | 36.23 |
| 2014 | 68.62 | 31.38 |
| 2015 | 79.8 | 20.2 |
| 2016 | 71.97 | 28.03 |
| 2017 | 70.43 | 29.57 |
| 2018 | 71.12 | 28.88 |
| 2019 | 71.76 | 28.24 |
| 2020 | 76.54 | 23.46 |
| 2021 | 78.98 | 21.02 |
| 2022 | 81.9 | 16.8 |
| 2023 | 81.5 | 17.17 |
| 2024 | 88 | 11.75 |
| 2025 | 93 | 7 |
Updated (22-12-2025): In Q2 2025, NVIDIA’s market share rose from 92% in Q1 2025 to 94% of the GPU market. During the same period, AMD’s share declined from 8% to 6%, while Intel’s share remained at 0%, according to Jon Peddie Research.
Overall, the first half of 2025 shows NVIDIA averaging 93% of the GPU market, with AMD at 7% and Intel effectively absent.
The data used for this analysis is sourced from Yahoo Finance, Statista, JPR, Nvidia, and AMD PRs, where it is available in quarterly form. To provide a clearer yearly comparison of discrete GPU market share for each company, the average of Q1, Q2, Q3, and Q4 data for each year was calculated.
NVIDIA vs. AMD vs. Intel (2022 – 2024)
In 2022, Intel captured approximately 1.33% of the discrete GPU market. While the company made efforts to maintain this presence in 2023, its market share declined to roughly 1%.
By 2024, until the first three quarters, NVIDIA and AMD adopted aggressive strategies that resulted in Intel’s GPU market share falling to 0% once again.
But in Q4 2024, Intel gained around 1.2%. Thus, it looks alive so far.
Here are the annual market share of NVIDIA, AMD, and Intel
| Year | NVIDIA | AMD | Intel |
|---|---|---|---|
| 2022 | 81.9% | 16.8% | 1.33% |
| 2023 | 81.5% | 17.17% | 1.33% |
| 2024 | 88% | 11.75% | 0.25% |
| 2025 | 93% | 7% | 0% |
According to data released by Jon Peddie Research (JPR), AMD’s slice of the AIB market shrank 7.3 points quarter-over-quarter, leaving them with 8% market share. Intel’s slipped 1.2 points, dropping to 0% market share, while Nvidia’s grew 8.5 points to reach 92% of the GPU market.
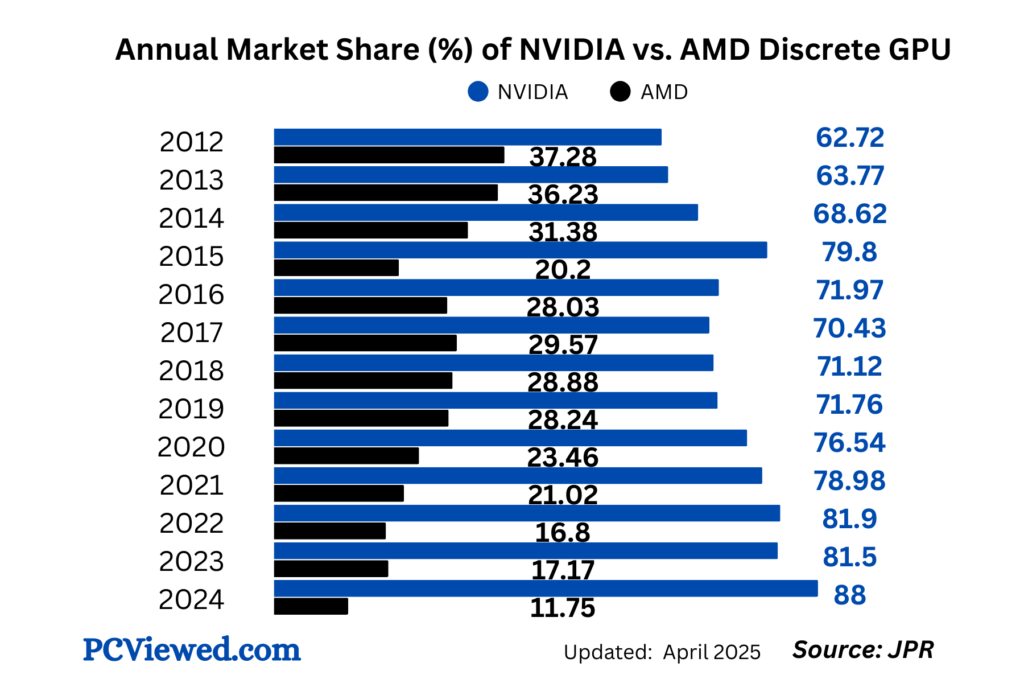
Infographic:
Infographic displaying the yearly market share data of discrete GPUs from NVIDIA and AMD in the PC market from 2010 to 2024 (Including Q4 2024).
You might also like to read: